This is what it sounds like to count from 1 to 255 in binary (music courtesy of Jake Joaquin). It’s so simple, reflecting the simplicity of binary code; yet it speaks volumes about the structure of binary numbers. It inspired me to draw a picture, so I could see what binary counting looks like as well:
You’ll understand the diagram after I explain how the Binary Clicker works.
The Binary Clicker
Jake named his creation the Binary Clicker. The song has 255 evenly-spaced notes, each note representing one 8-bit binary number in the sequence from 1 to 255. How can you represent 8 bits with one note? You can’t. But you can choose one representative bit from each number and still convey some information about it.
Each bit position is assigned a different tone, ascending in pitch from the least significant bit position to the most significant bit position. The tone played on each beat is that associated with the bit that changes from 0 to 1 — there is one and only one such bit per count. This 1 bit is the least significant 1 bit of the current count; it’s the smallest power of two in the number. So in some sense, you’re hearing powers of two.
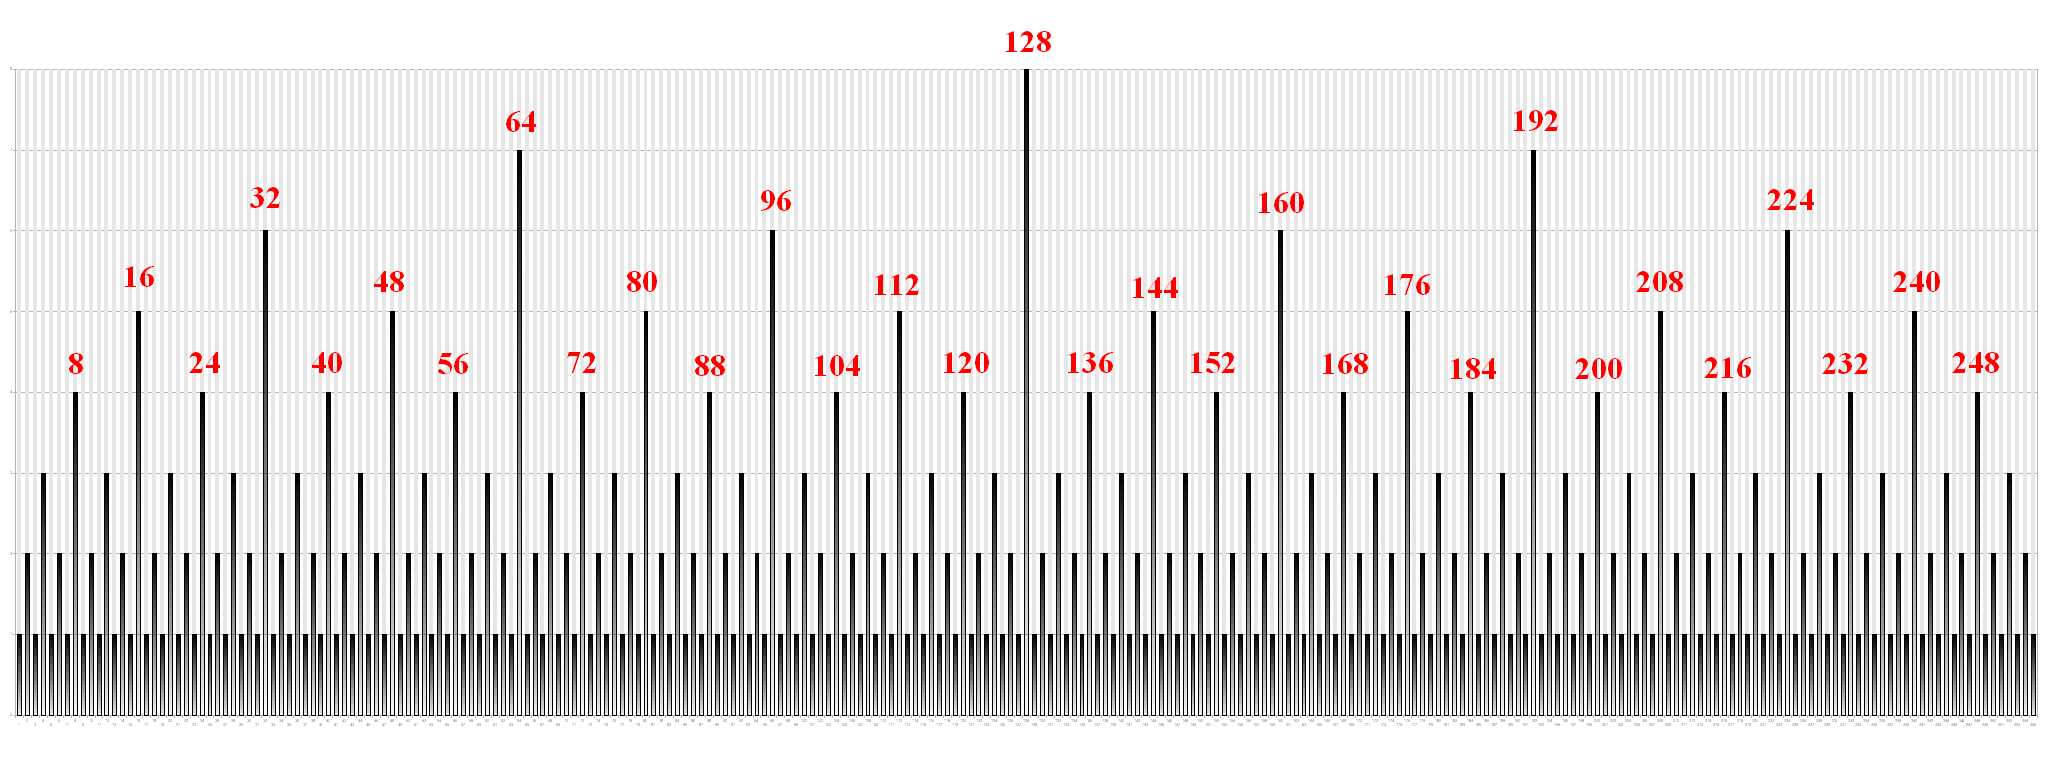
The Diagram
The diagram is a bar chart depicting the binary numbers from 1 to 255. The height of each bar corresponds to the bit position of the least significant 1-bit in each count. You could also think of it as the length of the suffix of the binary number from its lowest 1-bit down. For example, 40, which is 1010002, has a suffix of 1000, which is 4 units tall:
0
0
1
0
1
0
0
0
Numbers that end in the same binary string have the same bar height. For example, 48, which is 1100002, and 208, which is 110100002, both end in 10000.
The diagram is full of symmetry. If you remove the highest bar and cut the diagram in half, you’re left with two equal halves. You can do this seven times in all, each time generating symmetric halves.
The count 00000000 is not included in the diagram. It would be a 0-height bar because it has no 1 bits. Besides, including it would mess up the symmetry 🙁 .
The Song and the Diagram Together
The song and diagram mirror each other: the same tones have the same bar heights; the repeating subsections of music reflect the symmetry in the diagram; the one-beat rest you can’t hear at the start of the song is the 0-height bar missing from the diagram. To appreciate this, play the tune and follow along in the chart.
Although there is a bar for each note, it’s likely you’ll gravitate to a subset of notes as the melody. I hear a 31-note melody (well, more like a metronome beat), marked by the red numbers in the chart. Those are the decimal values of the counter on those beats.
I think of the song as 31 8-tone measures preceded by a 7-tone pickup measure. You could just as easily hear 31 full 8-tone measures followed by an incomplete measure of 7-tones. In that case the high tone would be the last note of each measure. There are lots of possible interpretations given the symmetry. You might even hear measures that are other powers of two in length.
Patterns in Binary Counting
The sequence of binary numbers generated by a counter has a regular, predictable pattern. The lowest bit position toggles to 1 the most frequently, for the numbers 1, 3, 5, 7, etc. The next higher bit position toggles to 1 half as frequently, for the numbers 2, 6, 10, 14, etc. The highest bit position toggles to 1 the least frequently — only for the number 128. You can see it in the diagram, as well as hear it in the song.
| Tone No. (Bit Position) | Occurrences | Beat Numbers (Count) |
|---|---|---|
| 1 | 128 | 1, 3, 5, 7, … , 247, 249, 251, 253, 255 |
| 2 | 64 | 2, 6, 10, 14, … , 242, 246, 250, 254 |
| 3 | 32 | 4, 12, 20, 28, … , 228, 236, 244, 252 |
| 4 | 16 | 8, 24, 40, 56, … , 200, 216, 232, 248 |
| 5 | 8 | 16, 48, 80, 112, 144, 176, 208, 240 |
| 6 | 4 | 32, 96, 160, 224 |
| 7 | 2 | 64, 192 |
| 8 | 1 | 128 |
Changing the Tempo
I noticed something interesting when the music is slowed down (thanks to Joe for doing that for me). At 50% tempo, I hear a 3-tone pickup measure followed by 63 full 4-tone measures. It slowed down enough so I could hear more detail, twice as much if you will. Relating to my diagram, I now hear all the notes in the third row prominently.
A similar effect happens at 25% tempo. I didn’t try 200%, but I imagine it would be similar, but in the other direction.

I found another musical binary counter. It assigns a different percussion sound to each bit, rather than different tones. (Listen to it through good speakers or headphones to hear all the sounds.)
Absolutely fascinating! Leibniz tried correlating colors with sounds, but before that you need to correlate colors with functions. This can be done with the 16 basic binary functions, i.e., function -> sound -> color.
Anything can be reduced to binary spaces (see my papers on my website), but when presented with a giant matrix of 0s and 1s, the issue is that of discerning a pattern in that space. One approach is: http://videolectures.net/kdd09_ye_mdpbmf/ .
If we see a regularity in the space, then what does this mean? See Andrew Wuenche’s work on basins of attraction, where patterns are randomly generated by a concatenation of binary functions. The question is “what do they mean”? Is there truly order from chaos? For one think that there is order or structure inherent in the universe (as Wheeler the physicist – it from bit -and other have stated), I find it hard to think that something (a pattern) comes from nothing, or randomness or even chaos (potential order).
I’d like to communicate with you or anyone else on this, if interested.